Sunday, April 23, 2017

Useful Embedded System Log output

I put my previous project on hold recently, as I wanted to create a better way of logging system status in my embedded projects.  Luckily for me, the people who make vcdMaker already had a great way to do this.  In the video below, I got a bit more into detail about how I log the information.  Please visit the vcdMaker website and check out the videos, they are really good.  I hope that you find vcdMaker as useful as I do.

The log output is only as good as it's time stamp, so I wanted to ensure that my time stamp was good.  I usually run my SysTick handler at 1 kHz or 1 ms tick rate.  I enabled a general purpose input / output pin on the STM32F429 micro controller and had it toggle on and off.  I was able to verify with the Logic Analyzer and the Scope that the tick rate is indeed 1 kHz. You can see those screen captures below.

Logic Analyzer screen capture

Oscilloscope screen capture
My system clock and advanced high performance bus clocks are setup as 180 MHz.  The advanced peripheral bus 1 clock is set to 45 MHz, while the advanced peripheral bus 2 clock is set to 90 MHz.
This allows me to set USART 1 to 115200 baud, for now this is adequate.  I may need to speed this up in the future.  The USART Driver is called from the _write() system call, which allows me to use stdio printf function to print the messages to the USART.  

I created a little API to log messages:

log_signal_message(char* signalname, uint8_t signal_size, char* format, ...)

log_signal_event_message(char* signalname, char* format, ...)

log_message(eMessageType_t type, char* format, ...)

The messages logged by these functions are queued for the logger task to print to the USART.  The logger task is only 1 priority level higher than the idle task.  This allows the logger task to send messages without interfering with tasks that have higher priority.  The logger task uses a blocking call to receive from the queue, with a delay set to the maximum available.  The allows the task to only work when it must.  The video below gives some more information as well as a short demo of how I am using this setup.  Hopefully, you find this useful.


Saturday, March 25, 2017

Debug Console

This is a quick post to show the debug console in my current project.  The project uses a STM32F4 Cortex M4 micro controller, and I have used Putty to connect to the debug out USART.


Saturday, November 26, 2016

ITM Setup for debugging in GNU ARM projects

I finally got around to setting up ITM (Instrumentation Trace Macrocell) based output for debugging.

The first thing I did was setup OpenOCD to handle the output from the processor.  I have included my configuration file for  OpenOCD below:

##  This is the Test Rom Board
##  Core429I Board
##  STM32F429IGT6 ARM Cortex-M4

##  Use the STLINK V2 Debug Probe
source [find interface/stlink-v2.cfg]

##  This is setup with Serial Wire Debug
set WORKAREASIZE 0x20000
transport select hla_swd

##  Use Generic STM32F4x chip setup support
source [find target/stm32f4x.cfg]

##  Reset (software only reset)
reset_config srst_only srst_nogate

##  Boost Adapter speed to 4 MHz
adapter_khz 4000

## Configure SWO/SWV
## System Core Clock 180 MHz
## Baud Rate 2 Mbaud/s
tpiu config internal debug.log uart off 180000000 2000000

The important part of this configuration file is the last section, denoted by the Configure SWO/SWV comment.  This is all explained very well in the OpenOCD documentation for tpiu config.  I modified my configuration to spit the ITM output to debug.log, you need to give the SysCoreClock frequency in Hertz, as well as specify the baud rate.

The next thing you need to do is implement at least the _write system call.  I have included my implementation of that method below:

int _write(int file, char *ptr, int len)
{
  REQUIRE(file);
  REQUIRE(ptr);

  ENSURE(len >= 0);

    int DataIdx;

    switch(file)
    {
    case STDOUT_FILENO:
    case STDERR_FILENO:

        for (DataIdx = 0; DataIdx < len; DataIdx++)
        {
            ITM_SendChar(*ptr++ &(uint32_t)0x01FF);
        }
        break;
    default:
    break;
    }

    return len;
}

If you are curious about the REQUIRE and ENSURE macros, you can find out about them here.  The linker options need to include the following to allow you to link against the nano c lib:

-lm --specs=nano.specs --specs=nosys.specs

In order to view the SWO/SWV output you need to use a viewer for the file, I am using swo-tracer that was written by Andrey Yurovsky.   I tested the whole setup and received a Hello World! out of my embedded code as shown below.


Saturday, November 12, 2016

A weird problem in my build process...

I have been working recently on an embedded project and experiencing a very weird problem.  My main development machine runs Linux Mint and I use the GNU tool chain (gcc, make, etc).  This tool set usually gives me no issues, however I am seeing a warning about not finding a symbol:

arm-none-eabi-ld: warning: cannot find entry symbol Reset_Handler; defaulting to 0000000008000000

Now, if you search this, there are tons of answers on how this can happen.  There are even suggestions that changing the extension of the file from lower-case s to an upper-case S can fix the problem.
(This is because .S files are supposed to be prepossessed prior to assembling them and .s files are not.)

I had researched quite a bit and tried many different things to fix this.  I examined the linker script, the assembly files, the flags that were passed to the assembler, compiler, and the linker.  I consulted with quite a few friends of mine that do embedded development and they had some more suggestions for what the problem was.  I looked at almost everything that my friends suggested, and then something two of them agreed upon popped into my head.  They agreed that make "sucks", that it sometimes doesn't behave as you would want.  I don't entirely agree, but there it was.  The one thing that I hadn't really thought about in the equation of the problem - GNU make.

I decided to make a bare-bones embedded project with some of the existing files and manually call each step of my build process.  I assembled, compiled, and linked it manually.  Presto!  No issue, however when using my make file, I get the problem almost every time.

I like make, and it provides a lot of useful features, including the one that bit me for the last few months.  GNU Make allows you to call the shell, you can embed scripts in the file.  As it turns out I must not understand this feature as much as I thought I did.  I had the following lines in my make file that caused my problem for months:

OBJECTS += $(ASM_SRCS:%.s=%.o)
OBJECTS += $(STD_LIB_SRCS:%.c=%.o)
OBJECTS += $(RTOS_SRCS:%.c=%.o)
OBJECTS += $(RTOS_ASM_SRCS:%.s=%.o)
OBJECTS += $(HAL_SRCS:%.c=%.o)
OBJECTS += $(APP_SRCS:%.c=%.o)
OBJECTS += $(OS_SRCS:%.c=%.o)
OBJECTS += $(C_SRCS:%.c=%.o)

OBJECT_FILES := $(shell find $(OBJ_PATH) -name '*.o')

...

link: $(OBJECTS)

@$(LD) $(LDFLAGS) -o $(OBJ_PATH)/$(ELF_IMAGE_NAME) $(OBJECT_FILES)

The intent of these lines is to create a list of the objects and link them after they have been moved to a build folder.  I am sure at the point in time that I wrote this, it made some sense to me.  I look at it now, and wonder what the hell I was thinking.  The objects were getting built and moved to the build directory, but they hadn't always been moved to the build directory prior to the OBJECT_FILES list being generated by the shell command.

I have since removed the shell script execution line and changed the link target.  The problem is gone, I can execute any target, in any order and it builds perfectly.  The moral of this story is, always understand all your tools, and never think that a tool can't be the problem.  
(Technically, the tool did what I asked it to, so it was still my fault!)


Monday, July 25, 2016

I Aquired another upgrade!

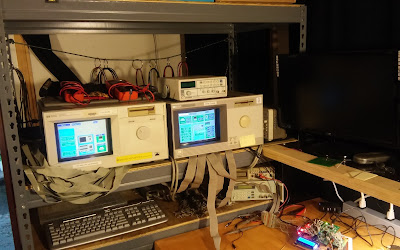
I was looking around and found a decent price on another mainframe instrument.  I was able to get a HP 16500A model, with a pattern generator (HP16520A & HP16521A), timing analyzer (HP16510B) and a 250 MHz 1 GS/sec oscilloscope card(HP 16532A). 


I moved the scope card into the HP 16500C mainframe and set everything back up.   The screen shot below shows both scopes recognized by the mainframe unit. 


The next thing I did was make sure that the scope cards worked, so I hooked up the function generator and did some simple tests.  First with just the 250 MHz scope, then with both the 500 MHz and 250 MHz scopes together in a group run.


This is great, now I can look at up to 4 Analog signals at the same time on the mainframe.

Saturday, May 21, 2016

Inter-module triggering isn't so bad.

In the post before last, I mentioned that I was interested in figuring out inter-module triggering system that the mainframe analyzer has. I decided it could be interesting to view a binary counter and the clock used to drive that counter.  I pulled out the tiny RioRand FPGA development board I have, and wrote more simple VHDL.  The Counter code will count up to 0x3F as well as break out the clock signal to a pin for analysis.  You can see the VHDL in the screen capture below.

Quartus with the VHDL

The board was setup to output the counter signals on pins 40-45, and the clock out on pin 143.  I didn't save this to the serial flash on the board, just ran it directly on the chip via the JTAG interface.
You can see the test setup below.

Test setup using FPGA board.

Pod 1 of the logic analyzer was hooked up to the counter signal pins as well as the clock out pin.
I also hooked up the channel one scope probe to the clout out pin, so I could view the analog clock signal.  Once the probes were all hooked up, I double checked that I could see signals on the analyzer. I setup the configuration, format, and triggers on the logic analyzer module to trigger on the counter signals from the FPGA.  After that I adjusted the settings on the oscilloscope module to make sure the analog clock signal was clearly displayed.  I then configured the scope to trigger after the logic analyzer in a group run chain.  You can see this in the screen shot below.

Intermodule configuration screen.

I ran a single shot group run to see what the time correlation bars would show, looks like they will capture almost the exact same instant.  Double checking the Scope module display proved that the group run triggering worked, you can see this in the screenshot below.

Oscilloscope capture from group run.
After a bit of playing around with the logic analyzer's user interface, I figured out how to add mixed signal information to the waveform display screen.  The below screenshot shows the counter signal output overlaid to display the count, the digital interpretation of the clock signal as well as the analog clock signal.  

Mixed Signal waveform screen.

This is a truly powerful setup, you can track digital logic glitches caused by analog signals this way.  Now, I wonder how difficult it is to work with the inverse assembler package....


Get the gunk out!

Since I acquired the HP 16500 C mainframe analyzer it needed some clean up.  I decided last night that I would clean it up a bit, since I couldn't sleep anyway.  The fans, and most of the case were covered in this greasy / sticky / nasty black soot like gunk.  I cleaned that off of every surface that I could, dried stuff off and re-assembled the analyzer.  Below are a few pictures I took during the process.

Main view of the chassis.

Power supply, hard drive and a fan bracket.

Side of CRT module and Fans.

Option Cards waiting re-installation.