Showing posts with label Development. Show all posts

Sunday, August 27, 2017

Sigrok is Awesome!

Just today I reviewed the sigrok project and found that they currently support my RIGOL DS1102E oscilloscope.  This is great, I wondered if that included protocol decoding as well.  I build the code from the latest git clones for each of the sub-projects that I needed, and went off to work trying this out.  I didn't take screenshots of the first few times I connected to the scope, as they just worked and I was more interested in getting to the protocol decoding.  I fired up my copy of CrossWorks for Arm and started writing some simple code to send data to a UART.  You can see this in the screenshot below.

UART Code for the first test.

Once I had that done, I flashed the firmware to a small Cortex-M0 development board I have and connect it to USB TTL serial converter.  The data was sent to my development workstation and I saw it in a screen session.  Next, I hooked up the oscilloscope probes to the proper micro-controller pins and connected to the oscilloscope with pulseview.  The screenshot below shows the traces, and the protocol being decoded!

UART signals decoded.

I also took a combined screenshot of how I was actually working with pulseview and CrossStudio at the same time.  Sometimes, people find that interesting.

Working with pulseview and CrossStudio.


I recorded a video of me working with pulseview and CrossStudio as I change code and view the firmware output.

Well, Until the next time.


Monday, May 1, 2017

FreeRTOS Tasks in Eclipse


I have been working with FreeRTOS for a while and finally decided to figure out how to properly get Eclipse to show the tasks as threads.  It is quite useful to know what other tasks are doing when you are debugging problems in your firmware.  This is a matter of enabling features within OpenOCD by changing configuration files for your target.  This post will center around configuring this for STMicroelectronics chips.  The first thing I would like to show is a working Eclipse/OpenOCD/GDB debug setup.

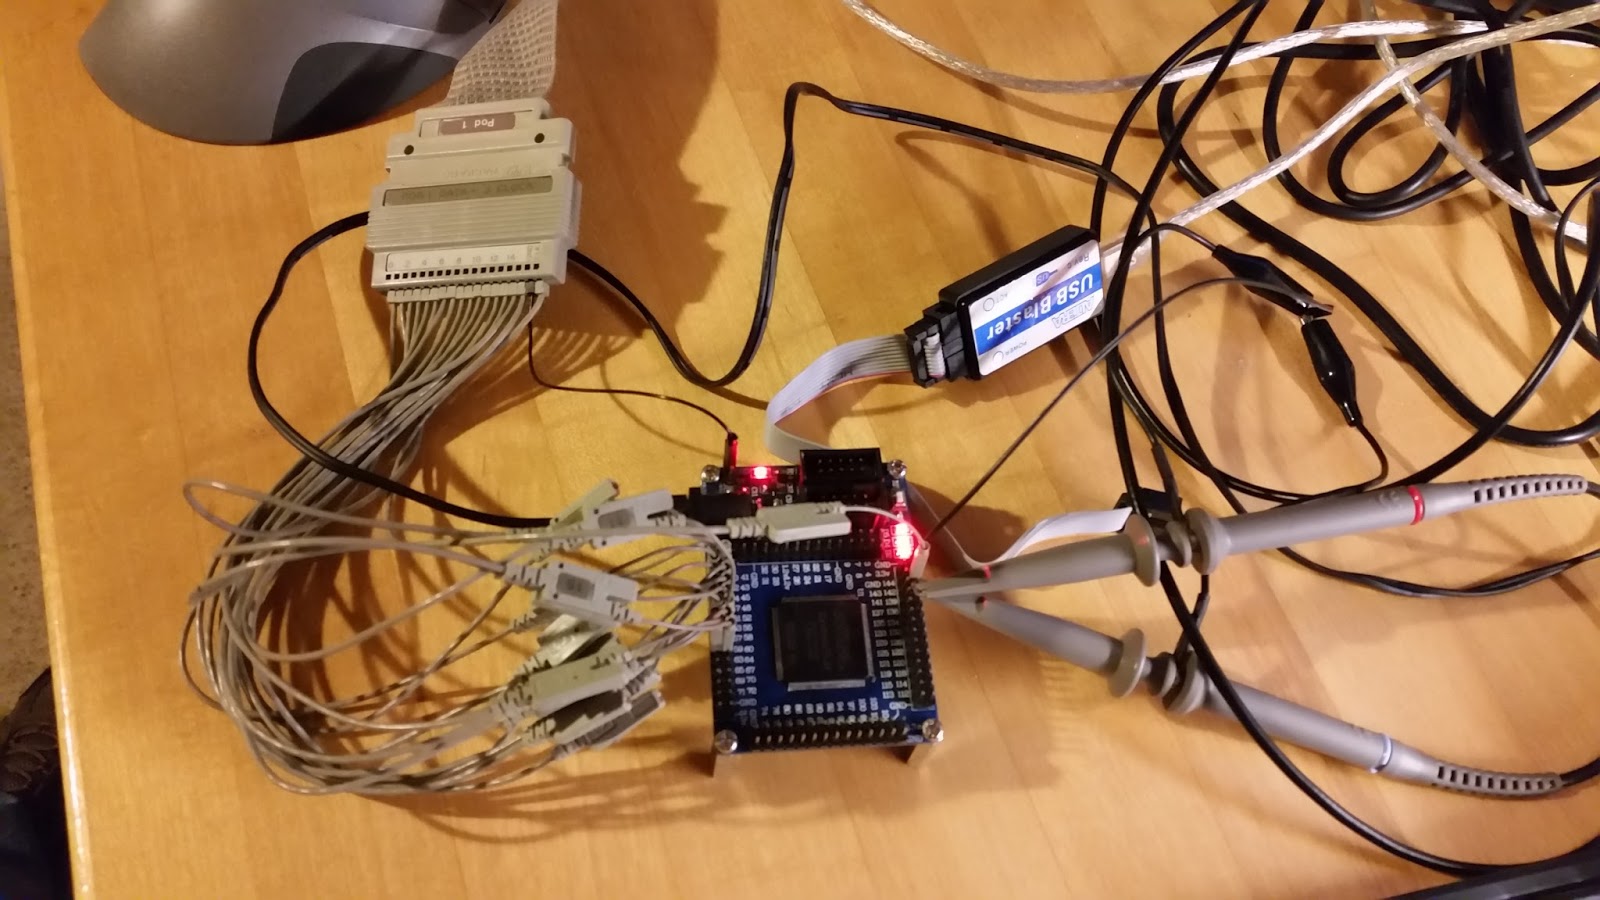
Non RTOS based Debug Setup Part 1
The above picture shows the normal setup I was using, a single configuration file for my target board.
The next picture shows the settings I used, to stop in main.

Non RTOS based Debug Setup Part 2

The contents of that file is below:

## This is the Test Rom Board
## Core429I Board
## STM32F429IGT6 ARM Cortex-M4
## Use the STLINK V2 Debug Probe
source [find interface/stlink-v2.cfg]

## This is setup with Serial Wire Debug
set WORKAREASIZE 0x20000
transport select hla_swd

## Use Generic STM32F4x chip setup support
source [find target/stm32f4x.cfg]

## Reset (software only reset)
reset_config srst_only srst_nogate

## Boost Adapter speed to 4 MHz
adapter_khz 4000

## Configure SWO/SWV
## System Core Clock 180 MHz
## Baud Rate 2 Mbaud/s
tpiu config internal debug.log uart off 180000000 2000000

The results of all of this configuration are shown below in the debugging screenshot:

Non RTOS Debugging Session

As you can see, there is a single thread.  This only allows me to see the exact spot in the code that I have currently stopped.  I would much rather be able to see what other tasks were running at the same time, and where they were in their execution at the exact moment the debugger halted everything.
In order for this to work, as the manual describes, we have to change the configuration file for the target to support using RTOS features.  Since I am using the STM32F4 series chips, I copied the stm32f4x.cfg file from /usr/share/openocd/scripts/target/stm32f4x.cfg to my utility directory in my code repository.  Once this file was copied I modified it to use the RTOS auto discovery, as shown below:

Modifying the stm32f4x.cfg file for RTOS debugging

I have highlighted the added text to enable auto discovery of RTOS usage.  The next thing I did was add a file called FreeRTOS_openocd.c to my project, the contents of this file are below:


/*
 * Since at least FreeRTOS V7.5.3 uxTopUsedPriority is no longer
 * present in the kernel, so it has to be supplied by other means for
 * OpenOCD's threads awareness.
 *
 * Add this file to your project, and, if you're using --gc-sections,
 * ``--undefined=uxTopUsedPriority'' (or
 * ``-Wl,--undefined=uxTopUsedPriority'' when using gcc for final
 * linking) to your LDFLAGS; same with all the other symbols you need.
 */

#include "FreeRTOS.h"

#ifdef __GNUC__
#define USED __attribute__((used))
#else
#define USED
#endif

const int USED uxTopUsedPriority = (configMAX_PRIORITIES -1);

Next, I modified my makefile to include a new linker option, which allows OpenOCD to work correctly with the RTOS features.  The linker option I added was:

-Wl,--undefined=uxTopUsedPriority

I rebuilt the entire project (make distclean; make all -j16) to rebuild all the modules.  I usually only do this when I need to rebuild standard peripheral libraries, FreeRTOS etc.  Usually, I only have to rebuild the application code I am working in.  

I then tested this by using OpenOCD and GDB from the command line to ensure that this worked, the steps are below:
  1. run in a terminal: openocd -f interface/stlink-v2.cfg -f stm32f4x_RTOS.cfg
  2. run in a terminal: arm-none-eabi-gdb build/debug/core4x9i.elf
  3. execute the following commands inside the GDB session:
    1. target remote localhost:3333
    2. continue
    3. Control-C
    4. info threads
The first step is shown below

Running OpenOCD configured for RTOS debugging
The second step is shown in the following screenshot:

Connecting GDB to OpenOCD for RTOS debugging

The third step, which shows the threads feature working is below:

RTOS task info as threads in GDB

This is great, it's all working properly now.  Might as well set this up inside Eclipse so we can debug in an easier way.  

The first debug configuration page in Eclipse starts out with the proper files for starting OpenOCD as follows:

RTOS debug setup part 1

The second configuration page is below:

RTOS debug setup part 2

You may have noticed the change to the "Set breakpoint at" setting, this value has been changed to the first task that gets started: logger_task.  You need to do this, otherwise the debugger will become confused and not present you with the normal Eclipse debug experience.  This stems from the fact that it won't know about the tasks unless you allow them all to start, prior to hitting a break point.  I know, I know, there are times when you want to debug without the RTOS threads!  So keep two configurations, RTOS enabled and not.  This way you can debug start up as well as the RTOS tasks.
Either way, once you have this all completed and working, it should look like the debug session below:

RTOS debug session in Eclipse

Now, like me, you can have two debug configurations.  Have fun coding!


Sunday, April 23, 2017

Useful Embedded System Log output

I put my previous project on hold recently, as I wanted to create a better way of logging system status in my embedded projects.  Luckily for me, the people who make vcdMaker already had a great way to do this.  In the video below, I got a bit more into detail about how I log the information.  Please visit the vcdMaker website and check out the videos, they are really good.  I hope that you find vcdMaker as useful as I do.

The log output is only as good as it's time stamp, so I wanted to ensure that my time stamp was good.  I usually run my SysTick handler at 1 kHz or 1 ms tick rate.  I enabled a general purpose input / output pin on the STM32F429 micro controller and had it toggle on and off.  I was able to verify with the Logic Analyzer and the Scope that the tick rate is indeed 1 kHz. You can see those screen captures below.

Logic Analyzer screen capture

Oscilloscope screen capture
My system clock and advanced high performance bus clocks are setup as 180 MHz.  The advanced peripheral bus 1 clock is set to 45 MHz, while the advanced peripheral bus 2 clock is set to 90 MHz.
This allows me to set USART 1 to 115200 baud, for now this is adequate.  I may need to speed this up in the future.  The USART Driver is called from the _write() system call, which allows me to use stdio printf function to print the messages to the USART.  

I created a little API to log messages:

log_signal_message(char* signalname, uint8_t signal_size, char* format, ...)

log_signal_event_message(char* signalname, char* format, ...)

log_message(eMessageType_t type, char* format, ...)

The messages logged by these functions are queued for the logger task to print to the USART.  The logger task is only 1 priority level higher than the idle task.  This allows the logger task to send messages without interfering with tasks that have higher priority.  The logger task uses a blocking call to receive from the queue, with a delay set to the maximum available.  The allows the task to only work when it must.  The video below gives some more information as well as a short demo of how I am using this setup.  Hopefully, you find this useful.


Saturday, March 25, 2017

Debug Console

This is a quick post to show the debug console in my current project.  The project uses a STM32F4 Cortex M4 micro controller, and I have used Putty to connect to the debug out USART.


Saturday, November 26, 2016

ITM Setup for debugging in GNU ARM projects

I finally got around to setting up ITM (Instrumentation Trace Macrocell) based output for debugging.

The first thing I did was setup OpenOCD to handle the output from the processor.  I have included my configuration file for  OpenOCD below:

##  This is the Test Rom Board
##  Core429I Board
##  STM32F429IGT6 ARM Cortex-M4

##  Use the STLINK V2 Debug Probe
source [find interface/stlink-v2.cfg]

##  This is setup with Serial Wire Debug
set WORKAREASIZE 0x20000
transport select hla_swd

##  Use Generic STM32F4x chip setup support
source [find target/stm32f4x.cfg]

##  Reset (software only reset)
reset_config srst_only srst_nogate

##  Boost Adapter speed to 4 MHz
adapter_khz 4000

## Configure SWO/SWV
## System Core Clock 180 MHz
## Baud Rate 2 Mbaud/s
tpiu config internal debug.log uart off 180000000 2000000

The important part of this configuration file is the last section, denoted by the Configure SWO/SWV comment.  This is all explained very well in the OpenOCD documentation for tpiu config.  I modified my configuration to spit the ITM output to debug.log, you need to give the SysCoreClock frequency in Hertz, as well as specify the baud rate.

The next thing you need to do is implement at least the _write system call.  I have included my implementation of that method below:

int _write(int file, char *ptr, int len)
{
  REQUIRE(file);
  REQUIRE(ptr);

  ENSURE(len >= 0);

    int DataIdx;

    switch(file)
    {
    case STDOUT_FILENO:
    case STDERR_FILENO:

        for (DataIdx = 0; DataIdx < len; DataIdx++)
        {
            ITM_SendChar(*ptr++ &(uint32_t)0x01FF);
        }
        break;
    default:
    break;
    }

    return len;
}

If you are curious about the REQUIRE and ENSURE macros, you can find out about them here.  The linker options need to include the following to allow you to link against the nano c lib:

-lm --specs=nano.specs --specs=nosys.specs

In order to view the SWO/SWV output you need to use a viewer for the file, I am using swo-tracer that was written by Andrey Yurovsky.   I tested the whole setup and received a Hello World! out of my embedded code as shown below.


Saturday, November 12, 2016

A weird problem in my build process...

I have been working recently on an embedded project and experiencing a very weird problem.  My main development machine runs Linux Mint and I use the GNU tool chain (gcc, make, etc).  This tool set usually gives me no issues, however I am seeing a warning about not finding a symbol:

arm-none-eabi-ld: warning: cannot find entry symbol Reset_Handler; defaulting to 0000000008000000

Now, if you search this, there are tons of answers on how this can happen.  There are even suggestions that changing the extension of the file from lower-case s to an upper-case S can fix the problem.
(This is because .S files are supposed to be prepossessed prior to assembling them and .s files are not.)

I had researched quite a bit and tried many different things to fix this.  I examined the linker script, the assembly files, the flags that were passed to the assembler, compiler, and the linker.  I consulted with quite a few friends of mine that do embedded development and they had some more suggestions for what the problem was.  I looked at almost everything that my friends suggested, and then something two of them agreed upon popped into my head.  They agreed that make "sucks", that it sometimes doesn't behave as you would want.  I don't entirely agree, but there it was.  The one thing that I hadn't really thought about in the equation of the problem - GNU make.

I decided to make a bare-bones embedded project with some of the existing files and manually call each step of my build process.  I assembled, compiled, and linked it manually.  Presto!  No issue, however when using my make file, I get the problem almost every time.

I like make, and it provides a lot of useful features, including the one that bit me for the last few months.  GNU Make allows you to call the shell, you can embed scripts in the file.  As it turns out I must not understand this feature as much as I thought I did.  I had the following lines in my make file that caused my problem for months:

OBJECTS += $(ASM_SRCS:%.s=%.o)
OBJECTS += $(STD_LIB_SRCS:%.c=%.o)
OBJECTS += $(RTOS_SRCS:%.c=%.o)
OBJECTS += $(RTOS_ASM_SRCS:%.s=%.o)
OBJECTS += $(HAL_SRCS:%.c=%.o)
OBJECTS += $(APP_SRCS:%.c=%.o)
OBJECTS += $(OS_SRCS:%.c=%.o)
OBJECTS += $(C_SRCS:%.c=%.o)

OBJECT_FILES := $(shell find $(OBJ_PATH) -name '*.o')

...

link: $(OBJECTS)

@$(LD) $(LDFLAGS) -o $(OBJ_PATH)/$(ELF_IMAGE_NAME) $(OBJECT_FILES)

The intent of these lines is to create a list of the objects and link them after they have been moved to a build folder.  I am sure at the point in time that I wrote this, it made some sense to me.  I look at it now, and wonder what the hell I was thinking.  The objects were getting built and moved to the build directory, but they hadn't always been moved to the build directory prior to the OBJECT_FILES list being generated by the shell command.

I have since removed the shell script execution line and changed the link target.  The problem is gone, I can execute any target, in any order and it builds perfectly.  The moral of this story is, always understand all your tools, and never think that a tool can't be the problem.  
(Technically, the tool did what I asked it to, so it was still my fault!)


Monday, July 25, 2016

I Aquired another upgrade!

I was looking around and found a decent price on another mainframe instrument.  I was able to get a HP 16500A model, with a pattern generator (HP16520A & HP16521A), timing analyzer (HP16510B) and a 250 MHz 1 GS/sec oscilloscope card(HP 16532A). 


I moved the scope card into the HP 16500C mainframe and set everything back up.   The screen shot below shows both scopes recognized by the mainframe unit. 


The next thing I did was make sure that the scope cards worked, so I hooked up the function generator and did some simple tests.  First with just the 250 MHz scope, then with both the 500 MHz and 250 MHz scopes together in a group run.


This is great, now I can look at up to 4 Analog signals at the same time on the mainframe.

Saturday, May 21, 2016

Inter-module triggering isn't so bad.

In the post before last, I mentioned that I was interested in figuring out inter-module triggering system that the mainframe analyzer has. I decided it could be interesting to view a binary counter and the clock used to drive that counter.  I pulled out the tiny RioRand FPGA development board I have, and wrote more simple VHDL.  The Counter code will count up to 0x3F as well as break out the clock signal to a pin for analysis.  You can see the VHDL in the screen capture below.

Quartus with the VHDL

The board was setup to output the counter signals on pins 40-45, and the clock out on pin 143.  I didn't save this to the serial flash on the board, just ran it directly on the chip via the JTAG interface.
You can see the test setup below.

Test setup using FPGA board.

Pod 1 of the logic analyzer was hooked up to the counter signal pins as well as the clock out pin.
I also hooked up the channel one scope probe to the clout out pin, so I could view the analog clock signal.  Once the probes were all hooked up, I double checked that I could see signals on the analyzer. I setup the configuration, format, and triggers on the logic analyzer module to trigger on the counter signals from the FPGA.  After that I adjusted the settings on the oscilloscope module to make sure the analog clock signal was clearly displayed.  I then configured the scope to trigger after the logic analyzer in a group run chain.  You can see this in the screen shot below.

Intermodule configuration screen.

I ran a single shot group run to see what the time correlation bars would show, looks like they will capture almost the exact same instant.  Double checking the Scope module display proved that the group run triggering worked, you can see this in the screenshot below.

Oscilloscope capture from group run.
After a bit of playing around with the logic analyzer's user interface, I figured out how to add mixed signal information to the waveform display screen.  The below screenshot shows the counter signal output overlaid to display the count, the digital interpretation of the clock signal as well as the analog clock signal.  

Mixed Signal waveform screen.

This is a truly powerful setup, you can track digital logic glitches caused by analog signals this way.  Now, I wonder how difficult it is to work with the inverse assembler package....


Get the gunk out!

Since I acquired the HP 16500 C mainframe analyzer it needed some clean up.  I decided last night that I would clean it up a bit, since I couldn't sleep anyway.  The fans, and most of the case were covered in this greasy / sticky / nasty black soot like gunk.  I cleaned that off of every surface that I could, dried stuff off and re-assembled the analyzer.  Below are a few pictures I took during the process.

Main view of the chassis.

Power supply, hard drive and a fan bracket.

Side of CRT module and Fans.

Option Cards waiting re-installation.

Saturday, May 7, 2016

New useful additions!

In my previous post I mentioned the mainframe instrument I purchased.  I had another run of luck on eBay and was able to purchase a few more pieces.  I was able to obtain at 2 channel scope and a 102 channel logic analyzer card.

The oscilloscope card has good specifications: 2 channels, each with a 2 GS/sec 8 bit analog to digital converter. Each channel is capable of 500 MHz Bandwidth.  The logic analyzer card is capable of 500 MHz timing and 100 MHz state analysis with 102 channels.  The new configuration is shown in the picture below.

Current Configuration
The initial oscilloscope card tests were done using my function generator hooked up to both channels with the same signal function output.  In the screenshot below, you can see the 3 MHz sin waves shown on both channels.

Function Generator Scope Trace


I decided it to test out the new cards using an FPGA development board I have laying around.  I set up the design logic to output 16 signals for logic analysis as well as clock outputs for the scope channels.  A picture of the board setup to test the instrument cards is below.

Test Setup

I hooked up one of the flying lead pods up to the logic analyzer cable, then to the pins on the FPGA development board.  The oscilloscope probes and logic analyzer clock input line are connected to clock output pins as well.   I wrote some simple VHDL to synthesize some signals to test the logic analyzer and to output the clock signals.  The screenshot from the oscilloscope below shows that the clock output is 50 MHz.

FPGA Scope Trace

The clock signal isn't super clean and you would want to use a Schmitt trigger to clean that up before using it to drive something.  At least we can verify that the 50 MHz clock going into the FPGA can be forwarded out of the FPGA.  

The logic trace is very busy as you can see below.  The labels on the left side designate which pin on the FPGA development board the leads are connected to.

FPGA Logic Trace

The next thing for me to tackle is to figure out how to setup an inter-module trigger and run that as a group.  I know this will be useful in the future with some up coming projects.  Have fun everyone, see you next time.


Saturday, April 30, 2016

A new piece of equipment!

I have been looking for a piece of equipment that is like a mixed signal oscilloscope, but more configurable, accurate and has a good price.  I was loosing hope when  I stumbled upon a used logic analyzer mainframe chassis on eBay while researching.

I noticed that the HP 16500 series mainframe, particularly the C model was exactly what I was looking for.  I began searching eBay frequently and doing research on the card configurations I was interested in.  Friday last week, I saw a C model chassis with the exact set of cards I was looking for and bought it.  The mainframe arrived Just yesterday!  Here is a picture of it below:


HP 16500 C
The mainframe actually came with a 4 GHz Timing / 1 GHz State logic analyzer card and the matching expansion card for it.  If you are using all 32 channels it will drop to 2 GHz timing mode.
The 4 GHz timing mode is enabled for 16 channels though, which is amazing.  The best thing about this is that I was able to buy it with all the pods as you can see below.


Logic Pods

The system software loaded to the hard drive also includes the symbol utility, which when combined with the inverse assembler is very powerful indeed.  Bill Buzbee used the inverse assembler and a HP Logic Mainframe to debug his homebrew CPU Magic!

There are still 3 more empty slots in the mainframe, I plan on getting a few more cards to allow me to cross trigger scopes and a pattern generator.  You can connect the C model to the local area network via a cat 5 cable.  This allows you to FTP into the machine and transfer files, mount the device as an NFS share, TELNET into it and give it direct commands, or even connect to the console via X Windows as a client.  The current configuration of the mainframe is visible in the picture below.

Current Configuration

I decided to test out the logic analyzer and pods on a current side project.  Below you can see what the waveform view from the logic analyzer looks like.

Waveform Screen

That's all for now, have fun everyone!

Saturday, March 19, 2016

MIPS Development board!

The other day I found a MIPS based development board and I knew I needed one.  I have loved the MIPS instruction set for a long time.  I bought a Creator Ci20 development board, which can be found at Imagination's web store.  I have found that most of the references to this board talk about Linux or Android, but I want to do bare-metal and work with real time operating systems on this board.

One brave developer embarked on a bare-metal project, which he hopes to get back to when he can. Nicholas's posts are listed out in his blog post: The CI20 bare-metal project.  His posts are really good and a great starting point into working with this board.  This is where I will start working from, reading his posts and building from his knowledge.  Thank you very much Nicholas for your project and detailed posts.

This being said, I grabbed crosstool-ng (latest version is 1.22) and built the mips-unknown-elf tools to work with the board in a bare-metal fashion.  First you must install crosstool-ng, then you use that to automatically build your tool chain.  If you want a list of the supported tool chain samples call crosstool-ng with the list-samples command: ct-ng list-samples.  This will print out a list of all the supported tool chain configurations it knows how to build.  I knew I wanted mips-unknown-elf, so I called crosstool-ng with the following command: ct-ng mips-unknown-elf and it built a configuration for the bare metal MIPS tool chain.  Finally, you tell crosstool-ng to build the tool chain for you with the following command: ct-ng build.  I left this to go about it's business while made myself a little adapter board.


The pin out for my existing TTL Serial converter don't match the board's pin out for the dedicated UART header. I don't want to continually reconnect jumper wires from the converter to the board.
I finished this, to notice that the tool chain was completely built, I think I now love crosstool-ng!
The tool chain appears to work, gcc complained about no input files, and gdb informed me that it was compiled to target mips-unknown-elf.


I have the tool chain, adapter for my TTL Serial converter, power adapter and Ethernet cable ready, I can plug it all together and power up the board.


I still need to: 
  1. Create a Bitbucket repository to store the code for this project.
  2. Setup the build system.
  3. Setup Doxygen to generate documentation.
  4. Setup a TFTP server to allow me to boot the board off development code easily.
  5. Setup scripts for build process to copy the image automatically to the TFTP location.
  6. Test to make sure board will boot the image from TFTP.

Saturday, March 5, 2016

Syntax files for UltraEdit on Linux

I wanted to make sure that the wordfiles used by UltraEdit on my workstation were up to date.
I am sort of lazy sometimes and really get tired of copying them from the website and placing them in the folder.

As it turns out IDM Computer Solutions uses github to handle the storage of it's wordfiles for UltraEdit, this is great.  On Linux, when you install UltraEdit the default wordfile directory is ~/.idm/uex/wordfile.

I went to the directory above the wordfile directory, ~/.idm/uex and removed the wordfile directory and then cloned the repository from IDM using the following command:
git clone https://github.com/IDMComputerSolutions/wordfiles.git.

Now, when I start up ultra edit it has all the syntax files available.  The real bonus now is that all I have to do is do is go to the wordfiles directory and do a git pull, to get the latest wordfiles.

Tuesday, January 26, 2016

My cscope and ctags setup

Along with my .vimrc setup, I typically use cscope and ctags to navigate around a tree of source code.  I typically setup two bash scripts to separate searching from generation of the files.  This way,
I can generate the search files for a large source tree only if I have to.

The first file I make is the update.sh script:

>------------------------------------ Start of Contents ------------------------------------<

#!/bin/bash

#   Remove all existing files that we use to search
rm -rf *.files *.out tags

#   Build all the tags
ctags -R --c++-kinds=+p --fields=+iaS --extra=+q ../.

# find all files for cscope to process
find ../. -name "*.c" -o -name "*.cpp" -o -name "*.s" -o -name "*.h" > cscope.files

#   Generate lookup and reverse lookup databases

cscope -b -q -k

>------------------------------------ End of Contents ------------------------------------<

Then I make the search.sh script:

>------------------------------------ Start of Contents ------------------------------------<

#!/bin/bash

#   Tell Cscope to use gvim ( this will allow multiple files to be open )
export EDITOR=gvim

#   Search with the just built databases
cscope -d


>------------------------------------ End of Contents ------------------------------------<

I keep these scripts in their own directory in a source tree, and work from that directory.
The directory tree is set up like this:


These scripts are setup to go up one directory from cscope directory, and then recursively build a list of .c,.cpp,.s and .h files so that they can be used by cscope to build a lookup database file and a reverse lookup database file.  This speeds up the searching on larger code bases (like the one I use at work).  

Hopefully, this will help someone besides myself.  Have fun.

Saturday, January 23, 2016

My vim / gvim config file

I finally took the time to recreate the .vimrc like I use to have a while ago.  I am posting it here so I don't lose it again, maybe you will find some of it useful.

>------------------------------------ Start of Contents ------------------------------------<

" Set to automatically read when a file is changed from the outside
set autoread

" Always show current position
set ruler

" Configure backspace so it acts as it should act
set backspace=eol,start,indent

" Ignore case when searching
set ignorecase

" When searching try to be smart about cases
set smartcase

" highlight search
set hlsearch

" incremental search
set incsearch

" Don't redraw while executing macros
set lazyredraw

" Regex Magic
set magic

" Extra margin to the left
set foldcolumn=4

" Turn on folding
set foldmethod=syntax

" Enable syntax highlighting
syntax enable

" show partial commands
set showcmd

" display line numbers
set number

" Color Scheme
try
 colorscheme desert
catch
endtry

set guifont=Hack\ 10

set background=dark

" utf8 encoding as en_US default
set encoding=utf8

" Unix file as the standard file type
set ffs=unix,dos,mac

" No backup etc
set nobackup
set nowb
set noswapfile

" Use spaces not tabs, and be smart about it.
" 1 tab = 4 spaces
set expandtab
set smarttab
set shiftwidth=4
set tabstop=4

" Use actual tabs for makefiles only!
autocmd Filetype make   setlocal noexpandtab

" Auto, smart indent
set ai
set si


" Set Window Size
set lines=50 columns=132


>------------------------------------ End of Contents ------------------------------------<

And a picture of what it looks like while viewing  C files:


Sunday, August 16, 2015

Power Supply Firmware Upgrade

This weekend I decided to upgrade the firmware in my home made power supply.  I wanted to increase the stability of the voltage measurement and the response of the display.
  Oversampling the ADC is how I decided to increase the accuracy and stability of the voltage measurement.  I chose to use a new architecture, that utilizes a real time operating system.  The first RTOS that came to mind for an 8-bit microchip processor was OSA RTOS.  This is a wonderful, tiny RTOS that is meant to be used on very small processors, such as the PIC18F46K22 that is inserted into the READY for PIC board used in my power supply.  I bought the board from MikroElectronika, just for this project.  The below picture shows the power supply with the top open, you can see the READY for PIC board on the right near the back.


The firmware architecture is fairly simple, I used 3 tasks in conjunction with message passing.
The firmware entry point ( main ) sets up this architecture and then schedules all tasks, this can be seen below in the diagram.


The firmware first initializes the system, which consists of board support type operations such as LCD, ADC and Timer initialization routines.  After this, the real time operating system is initialized, and the tasks are created.  Once those steps are complete, we need to have the operating system enable all the interrupts, so that the scheduler can cycle between tasks.  Finally, we enter into an infinite loop that will schedule time for each task in turn.

The first task, is also the most complicated one.  The handle samples task, manages the ADC sampling, voltage monitor oversampling and decimation.  This task actually samples 4 different ADC channels which all point to the same signal, this decreases the number of iterations
required to calculate the voltage value to display. The task makes use of a module called voltage monitor to handle the rolling over sample and decimation process.  Once it has the decimated value, it checks to see if the message is available, and then sends the decimated sample if possible.  In the event that there is a timeout while waiting for the message, the task will yield to the operating system scheduler.  This can all be seen in the below diagram.


The second task, is the update LCD task.  The diagram for this task is found below.

As you can see from the diagram, this task simply waits until there is a message to update the LCD.
If there is a message available; it will be retrieved, the voltage will be calculated, then output buffers will be built and displayed.  Again, like the handle samples task, if the message is not available, the task will yield to the operating system scheduler.

The final task, the idle task is very simple.  This is a task I used mostly for debugging the system. However in the future, it could be used to gather real time data about the system if I add more features.  For instance, I could add PC based control of the power supply via a UART.  There would be a task added to handle the commands from the UART, I could add a command to retrieve the diagnostic data from the global status structure.  Currently, the idle task tracks operating system errors, operating system event errors, operating system messages received and sent.  The flow of the idle task can be seen in the diagram below.


You may have noticed common theme in the way the tasks behave, namely that they always yield to the operating system scheduler as soon as they can.  This promotes a fast responsive application. The task flow knows the best possible way to give control back to the operating system, so it is best to do that when possible.

As I worked on this project, I used a logic analyzer to capture start up to full task scheduling in the application.  You can see that screenshot below, if you want to see a video of me talking about the power supply and this upgrade please use this link to view the video.


Sunday, June 21, 2015

RioRand EP2C5T144 Altera Cyclone II FPGA Mini Dev Board


Around March this year I received this mini FPGA dev board.  I have finally had some time to work with it some.  I found a good bit of helpful information available on Leon Heller's Page for this board.  I wrote a real quick test project, the code (VHDL) is below. Here is the link for the video of the project working.

library IEEE;
 use IEEE.STD_LOGIC_1164.ALL;
 use IEEE.numeric_std.all;

 entity TestProject is
    Port (
           Clk_In : in  std_logic; -- Clock in from board (50 Mhz)
           led_1 : out std_logic;  -- Labeled D2 on board
              led_2 : out std_logic;  -- Labeled D4 on board
              led_3 : out std_logic   -- Labeled D5 on board
            );
 end TestProject;

 architecture RealTimeLogic of TestProject is
    constant slow_count : natural := 48000000;
     constant fast_count : natural := 12000000;
    signal Reset : std_logic;
 begin
   
    Reset <= '0';     -- Clear Reset.
    alternating_led_sequence : process(Clk_In,Reset)
        variable alternating_led_counter: natural range 0 to slow_count;
        begin
        if Reset = '1' then
            alternating_led_counter := 0;
            led_1 <= '1';
                led_2 <= '1';
        elsif rising_edge(Clk_In) then
                --    Handle the Oscillating Led sequence.
            if alternating_led_counter < slow_count/2 then
                alternating_led_counter := alternating_led_counter + 1;
                led_1 <= '1';
                     led_2 <= '0';
            elsif alternating_led_counter < slow_count then
                led_1 <= '0';
                     led_2 <= '1';
                alternating_led_counter := alternating_led_counter + 1;               
            else
                led_1 <= '1';
                     led_2 <= '0';
                alternating_led_counter := 0;
            end if;
            end if;
        end process alternating_led_sequence;
       
        blinking_led_sequence : process(Clk_In,Reset)
          variable blink_counter : natural range 0 to fast_count;
         begin
         if Reset = '1' then
                blink_counter := 0;
                led_3 <= '1';
         elsif rising_edge(Clk_In) then
                --    Handle the fast blinking Led Sequence
                if blink_counter < fast_count/4 then
                    blink_counter := blink_counter + 1;
                    led_3 <= '1';
                elsif blink_counter < fast_count then
                    led_3 <= '0';
                    blink_counter := blink_counter + 1;
                else
                    led_3 <= '1';
                    blink_counter := 0;
                end if;               
        end if;
         end process blinking_led_sequence;

 end RealTimeLogic;