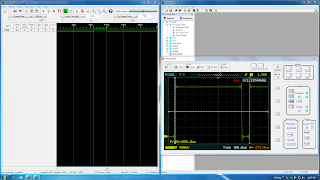
I ordered a Logic Port from PC Test Instruments and it arrived today. Here is a screenshot of a PWM signal on both my Rigol Oscilloscope and the Logic Port.
Friday, September 20, 2013
Thursday, September 12, 2013
MSP430 Debugging with open source tools
I recently switched to using open source tools to work on the msp430 micro controller architecture. The previous post included a few pictures of the in-circuit programming / debugging adapter I constructed. In this post I will talk a little bit about using Data Display Debugger on Linux to debug micro controller code. The screen shot below is an active debug session using the data display debugger.
 | |
| Data Display Debugger debugging firmware code. |
During the normal process of working with this micro controller one will use their favorite editor and either the msp430-gcc distribution tools directly or through a makefile to build the elf binary which is loaded to the micro controller.
A typical session looks as such:
 |
| mspdebug session connected to fet debugger |
In order to debug using the msp430-gdb debugger from the command line, you need to start the gdb client within the mspdebug application. The below screen shot shows this.
 | |
| mspdebug hosting gdb client |
Once the gdb client has been started, we can connect with the msp430-gdb debugger instance by using msp430-gdb binary-name.elf, as you see in the screen shot my application is Potentiometer.elf. After the gdb console session starts up, you must type into the command session target remote localhost:2000 as that is the port that mspdebug's gdb client is running on . A console based session is shown below.
 | |||
| msp430-gdb being used in console mode |
This is usable and quite fast, however it isn't very intuitive. Many developers would prefer to use a GUI debugger interface. The way to do that with these tools is to start the data display debugger from the command line in the following manner: ddd --debugger msp430-gdb binary-name.elf.
Aside from these steps, there is a way to just start the gdb client from the command line in one command as well: mspdebug rf2500 gdb 2000 .
Hopefully, this helps to make working with the debugger for msp430 micro controllers a little easier.
Subscribe to:
Posts (Atom)
